Triple Threat Fitness Competition
Triple Threat: the live screen system that ran a fitness competition
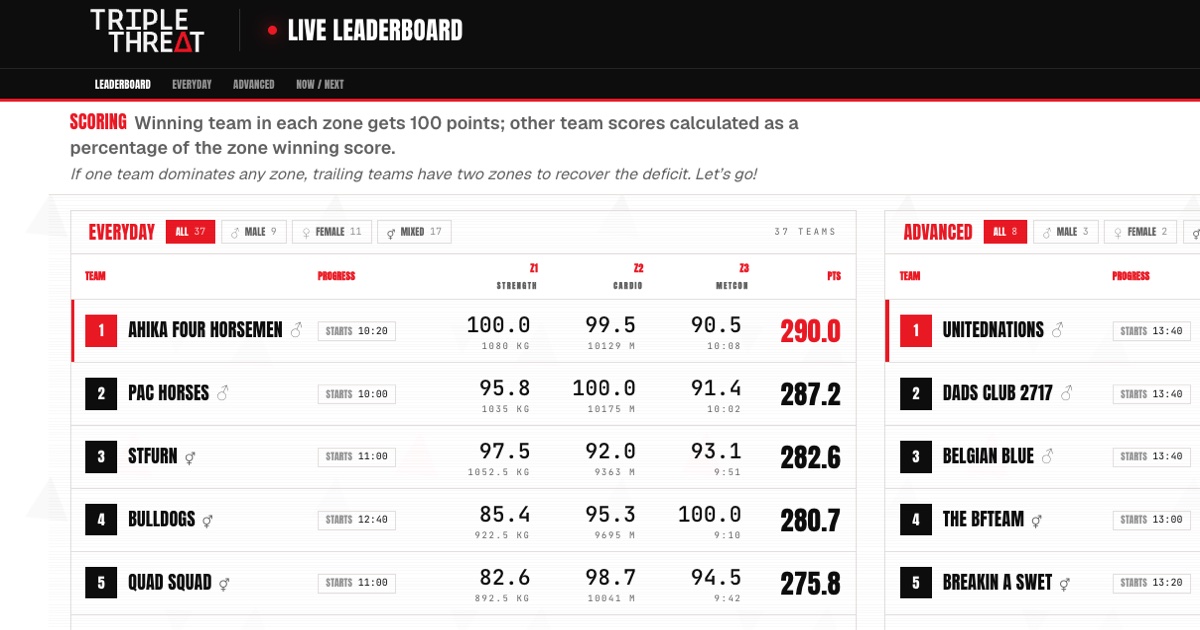
I built the live leaderboard, zone clock and now/next board for the Triple Threat fitness competition — the screens that drove its debut event for seven hours.
Challenge
A first-time fitness competition needed live standings on the big screen, a shared event clock around the gym, and a scoring system fair enough to keep every team fighting in every zone.
Approach
I built a single-purpose web app — live leaderboard, a 20-minute zone clock and a now/next board, all driven from one shared timer — and helped design a percentage-based scoring model recalculated through the day.
Outcome
The full screen system — leaderboard, clock and now/next — ran for seven hours at the debut event, held up under real load, and kept 45 teams and a packed room locked to the standings.
7 hours
Live event runtime
180 athletes
45 teams scored live
~3 seconds
Score-to-screen update
Most fitness competitions live or die on something the organisers rarely budget for: whether the room can actually see what's happening. You can have brilliant athletes and a packed house, but without live standings on a screen, it's just a lot of people working out at the same time. When the team behind the Triple Threat fitness competition were preparing for their very first event, that was the gap — and it's the gap I set out to close.
Background
Triple Threat is a team fitness competition: squads of four go head-to-head across three zones of work, with their combined points deciding the standings. It's the kind of grassroots event that builds a genuine community — not run by a global chain, just people who care about putting on something that people want to come back to.
The debut event was set for Sunday 7 June 2026, with 45 teams split across two divisions. The format was simple enough on paper, but running it live was not. Judges needed to record results for every team, across three zones, as the day unfolded. The whole gym needed to know where things stood, right now. And teams needed to know exactly when and where they were on next, so the event kept moving without a bottleneck. The standings had to be live, visible, and impossible to argue with — and because this was the first time the event had ever run, even the scoring rules were still up for discussion.
The challenge
The honest first option for any event like this is pen and paper, or a spreadsheet on someone's laptop. Both fall over the moment things get busy. A spreadsheet is slow to update, easy to fumble mid-event, and it gives spectators nothing to look at. Worse, every manual re-tally is a chance to introduce an error into the one thing a competition cannot get wrong: the score.
But a leaderboard on its own isn't enough. A live event has a heartbeat — a rhythm of teams rotating through zones on the clock. If that rhythm slips, the whole day runs late. So the room needed three things working in lockstep: a scoreboard everyone could see, a clock everyone was running to, and a clear signal of who was up next. And underneath all of it, the event needed a scoring system that was actually fair — one nobody could game.
Designing the scoring system
Because this was the first running of Triple Threat, the scoring model wasn't a given — it was a genuine design decision, and we worked through the options together.
A simple "add up your raw scores across the three zones" approach has a fatal flaw: the zones aren't directly comparable, so a team can win overall just by being strong in the one zone that happens to produce big numbers. That quietly encourages teams to coast — to save themselves for their best zone and write off the rest.
The model we settled on fixes that. In each zone, the winning team scores 100 points — a clean 100% — and every other team scores the percentage of the winner's result they achieved in that zone. So a team that posts 90% of the top result in a zone earns 90 points there. Add up the three zones and the team that's most consistently near the top across all of them comes out ahead.
The effect on the floor is exactly what you want: there's no zone worth giving up on. Fall too far behind in any one of the three and you simply can't recover it in the others, so every team has a reason to empty the tank in every zone, right to the end of the day. It rewards all-round excellence over a single party trick.
The catch is that this model never sits still. The instant a team posts a new best result in a zone, that becomes the new 100% — and every other team's percentage in that zone shifts with it. That's far too much arithmetic to redo by hand at pace, in front of a live crowd, without mistakes. So I didn't store the points at all. The database holds only each team's raw results — kilos lifted, metres rowed, time taken — and the leaderboard recomputes every team's zone percentages and overall standing from scratch each time it renders. A judge enters a new result, and within seconds every affected percentage has been recalculated and is on the screen. There's no separate recalculation step to run and nothing precomputed to drift out of sync — the maths simply happens on every update.
The approach
Around that scoring engine, I built a single-purpose web app to run the event's screens — three views, all sharing one source of truth.
The leaderboard is the main screen. Judges enter results, and the public standings re-rank instantly: the affected team's row pulses and slides to its new position, so the whole room sees the order shift in real time. From a result landing to the big screen updating takes under three seconds.
The zone clock sets the pace. It's a continuous 20-minute countdown shown on screens around the gym, started once at the gun and shared from a single timer so every screen agrees to the second. As each rotation winds down, the clock changes colour — green through most of the round, shifting to orange in the final five minutes and red in the last two — so a competitor mid-effort can read exactly how long is left from across the room.
The now/next board runs off that same clock. At any moment it shows which teams are live in each zone right now, and which teams need to be getting ready to go next. That's what keeps a packed event flowing without someone shouting names over the noise.
Everything the room sees is read-only. The actual scoring happens on a separate, password-protected judge page — and that protection isn't cosmetic. It's not just a hard-to-guess URL; every score change is checked on the server, so only a logged-in judge can write a result and anyone else is turned away. At an event where the leaderboard is on a screen in every corner of the gym, that's what stops a curious competitor from quietly nudging their own team up the board.
Under the hood I leaned on tools chosen for reliability rather than novelty: a Next.js web app on Vercel, with Supabase storing the live data and pushing updates out the instant anything changes. And because event day is exactly when things break, I built in deliberate fallbacks — if the live connection dropped, the screens fell back to checking for updates on a timer; the scores lived in a database that survived any crash or redeploy; and the clock kept itself running even through a refresh or a brief outage. None of it was glamorous. All of it was there so nothing could take the competition off the rails.
One last thing worth saying about how this was built. The leaderboard itself contains no AI — it's deterministic software, and it should be. You don't want a competition score that's anything other than exact. But I built the whole thing in around six hours, with Claude Code as my cockpit: an AI coding environment I drove to design, write, test and ship the app at a pace that simply wasn't on the table a year ago. That's the shift I actually care about — not bolting AI onto a product that doesn't need it, but using AI to build the right software, faster.
The outcome
It worked.
The whole system — leaderboard, zone clock and now/next board — ran for the full seven hours of the debut event. It handled real traffic from real people at a real event, held up under load, and did its job without intervention on the day. Forty-five teams across two divisions were scored live, the room ran to the clock, and competitors stayed glued to the screen, watching the standings move as the results came in. That's the difference between a workout and a competition: being able to see the race.
For me, this was a milestone of a particular kind. It proved I can take an idea, design the system around it, build the working software, and put it in front of people who are depending on it — and have it hold.
Reflection
The lesson I keep coming back to is the power of doing one thing properly. It would have been easy to over-scope — to bolt on registration, payments, athlete profiles and a dozen features nobody asked for. Instead, every part of this build pointed at one outcome: a competition that ran smoothly and scored fairly. Even the scoring model earns its keep by changing behaviour on the floor, not just keeping a tally.
That's the model I want for the work I take on: small, focused, genuinely useful software, built for real people running real events — reliable enough that they stop thinking about it and just get on with the day.